模板
The chart illustrates [核心主题] in [城市范围] [时间范围]. Overall, it is clear that [核心趋势]. Meanwhile, [核心趋势].
主体段 1(第一个对比维度)
Looking first at [第一个类别], it is obvious that [某对象1] had the highest [指标1] at [数据1]. [某对象2] was also high at [数据2], followed by [某对象3] at [数据3], and [某对象4] at [数据4].
主体段 2(第二个对比维度)
In terms of [第二个类别], [某特殊情况] at [数据1]. [某对象1] had the second-highest rate at [数据2], followed by [某对象2] at [数据3], [某对象3] at [数据4], and [某对象4] at [数据5].
主体段 3(第三个对比维度,适用于多类别图表)
[第三个类别] was [动作] by [比例描述] of people in all [范围]. [某对象1] had the highest rate at [数据1], followed by [某对象2] at [数据2]. [某对象3] came next at [数据3], while [某对象4和5] were much lower and close to each other, both around [数据4].
根据模板练习
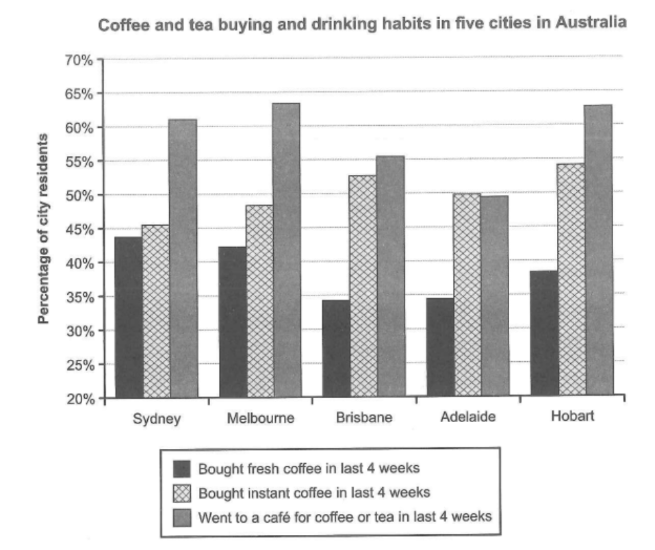
The chart illustrates the buying and drinking habits of coffee and tea in five cities in Australia during the last 4 weeks, Overall, it is clear that most people prefer to go to the cafe to drink coffee or tea. Meanwhile, instant coffee is more popular among people than fresh coffee.
illustrates v. 阐明
Looking first at visiting cafes, it is obvious that people in Melbourne and Hobart had the highest percentage at 64% and 63%, respectively. Sydney was also high at just over 60%, followed by Brisbane at over 55%, and Adelaide at under 50%.
respectively adv. 依次的
In terms of instant coffee, Adelaide was the only city where it was slightly more popular at 50%. Hobart had the second-highest rate at 54%, followed by Brisbane at 52%, Melbourne at 48%, and Sydney just over 45%.
Fresh coffee was purchased by fewer than 45% of people in all five cities. Sydney had the highest rate at 44%, followed by Melbourne at 42%. Hobart came next at 39%, while Adelaide and Brisbane were close to each other, both around 34%.